Visualizations
Install the raiwidgets package, the ExplanationDashboard has moved to the responsible-ai-toolbox repo:
pip install raiwidgets
Load the visualization dashboard in your notebook to understand and interpret your model:
from raiwidgets import ExplanationDashboard

ExplanationDashboard(global_explanation, model, dataset=x_test, trueY=y_test)
Once you load the visualization dashboard, you can investigate different aspects of your dataset and trained model via four tab views:
Model Performance
Data Explorer
Aggregate Feature Importance
Individual Feature Importance and What-If
Note
Click on “Open in a new tab” on the top left corner to get a better view of the dashboard in a new tab.
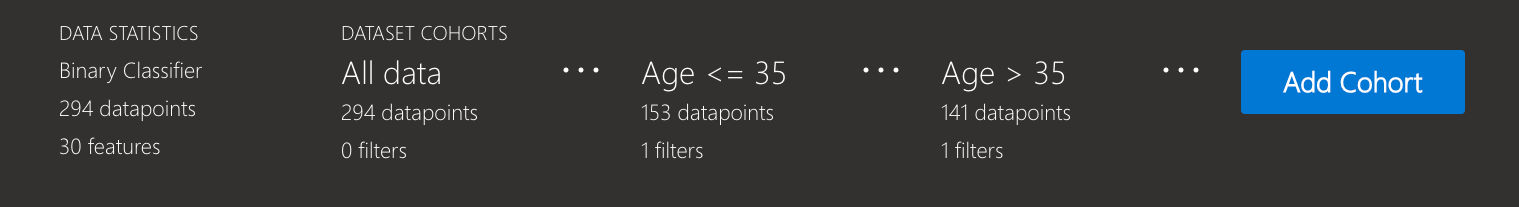
You can further create custom cohorts (subgroups of your dataset) to explore the insights across different subgroups (e.g., women vs. men). The created cohorts can contain more than one filter (e.g., age < 30 and sex = female) and will be visible from all of the four tabs. The following sections demonstrate the visualization dashboard capabilities on a classification model trained on employee attrition dataset. Besides the default cohort (including the whole dataset), there are two additional cohorts created: employees with Age <= 35 and employees with Age > 35.
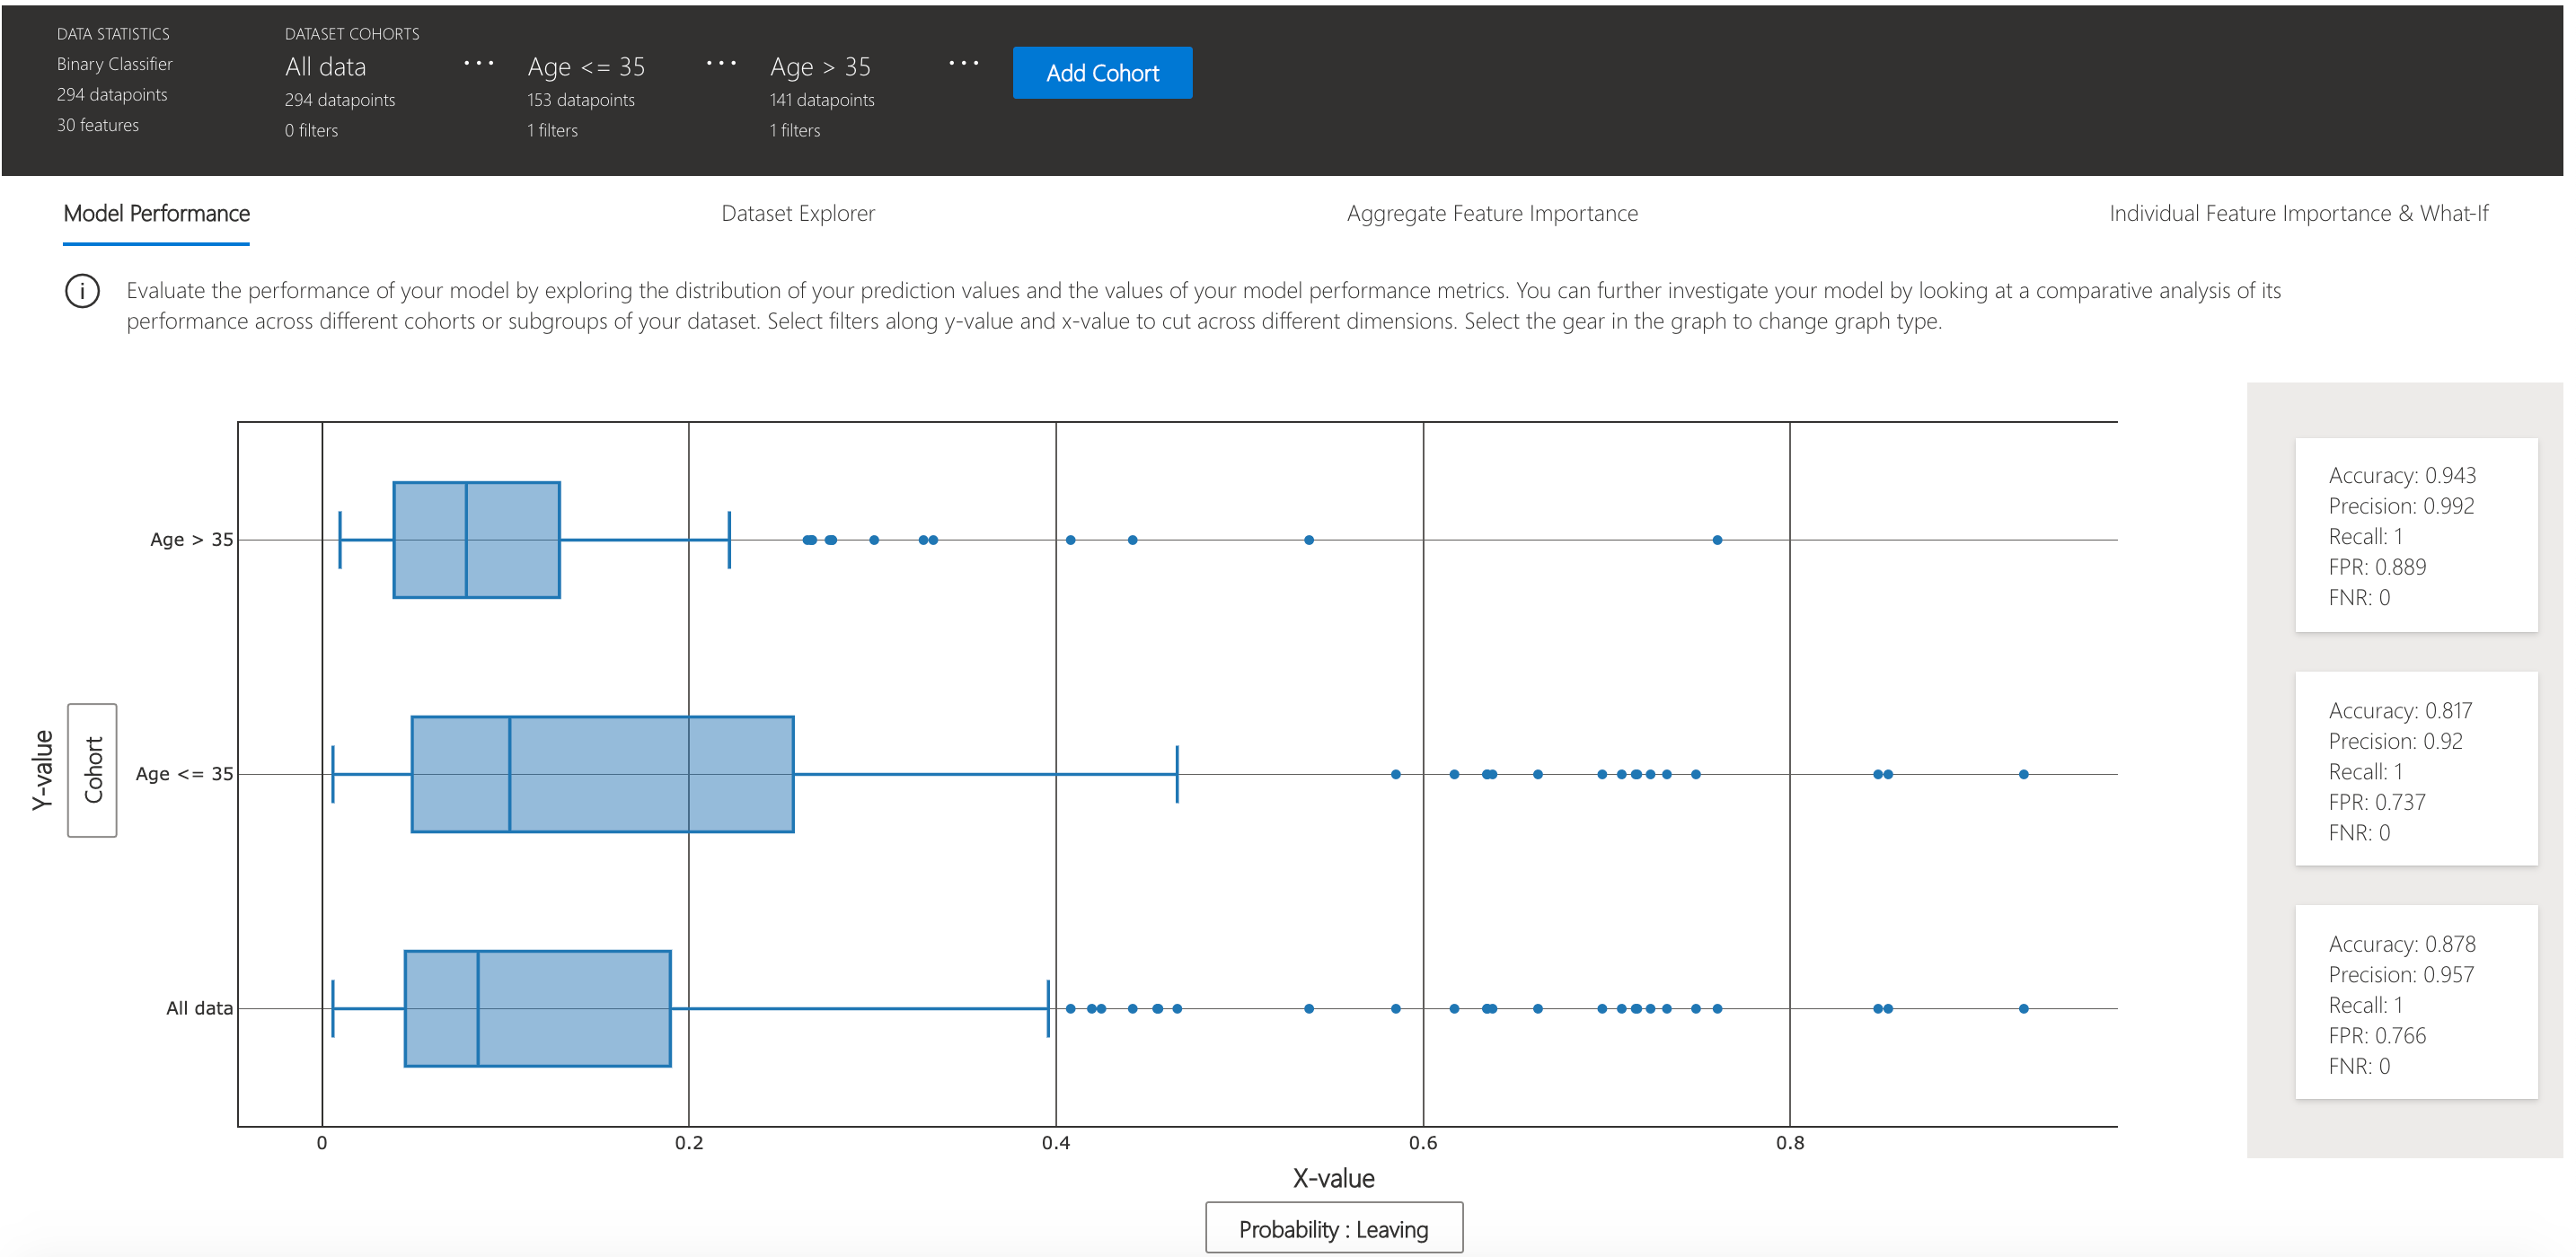
Model performance
This tab enables you to evaluate your model by observing its performance metrics and prediction probabilities/classes/values across different cohorts.
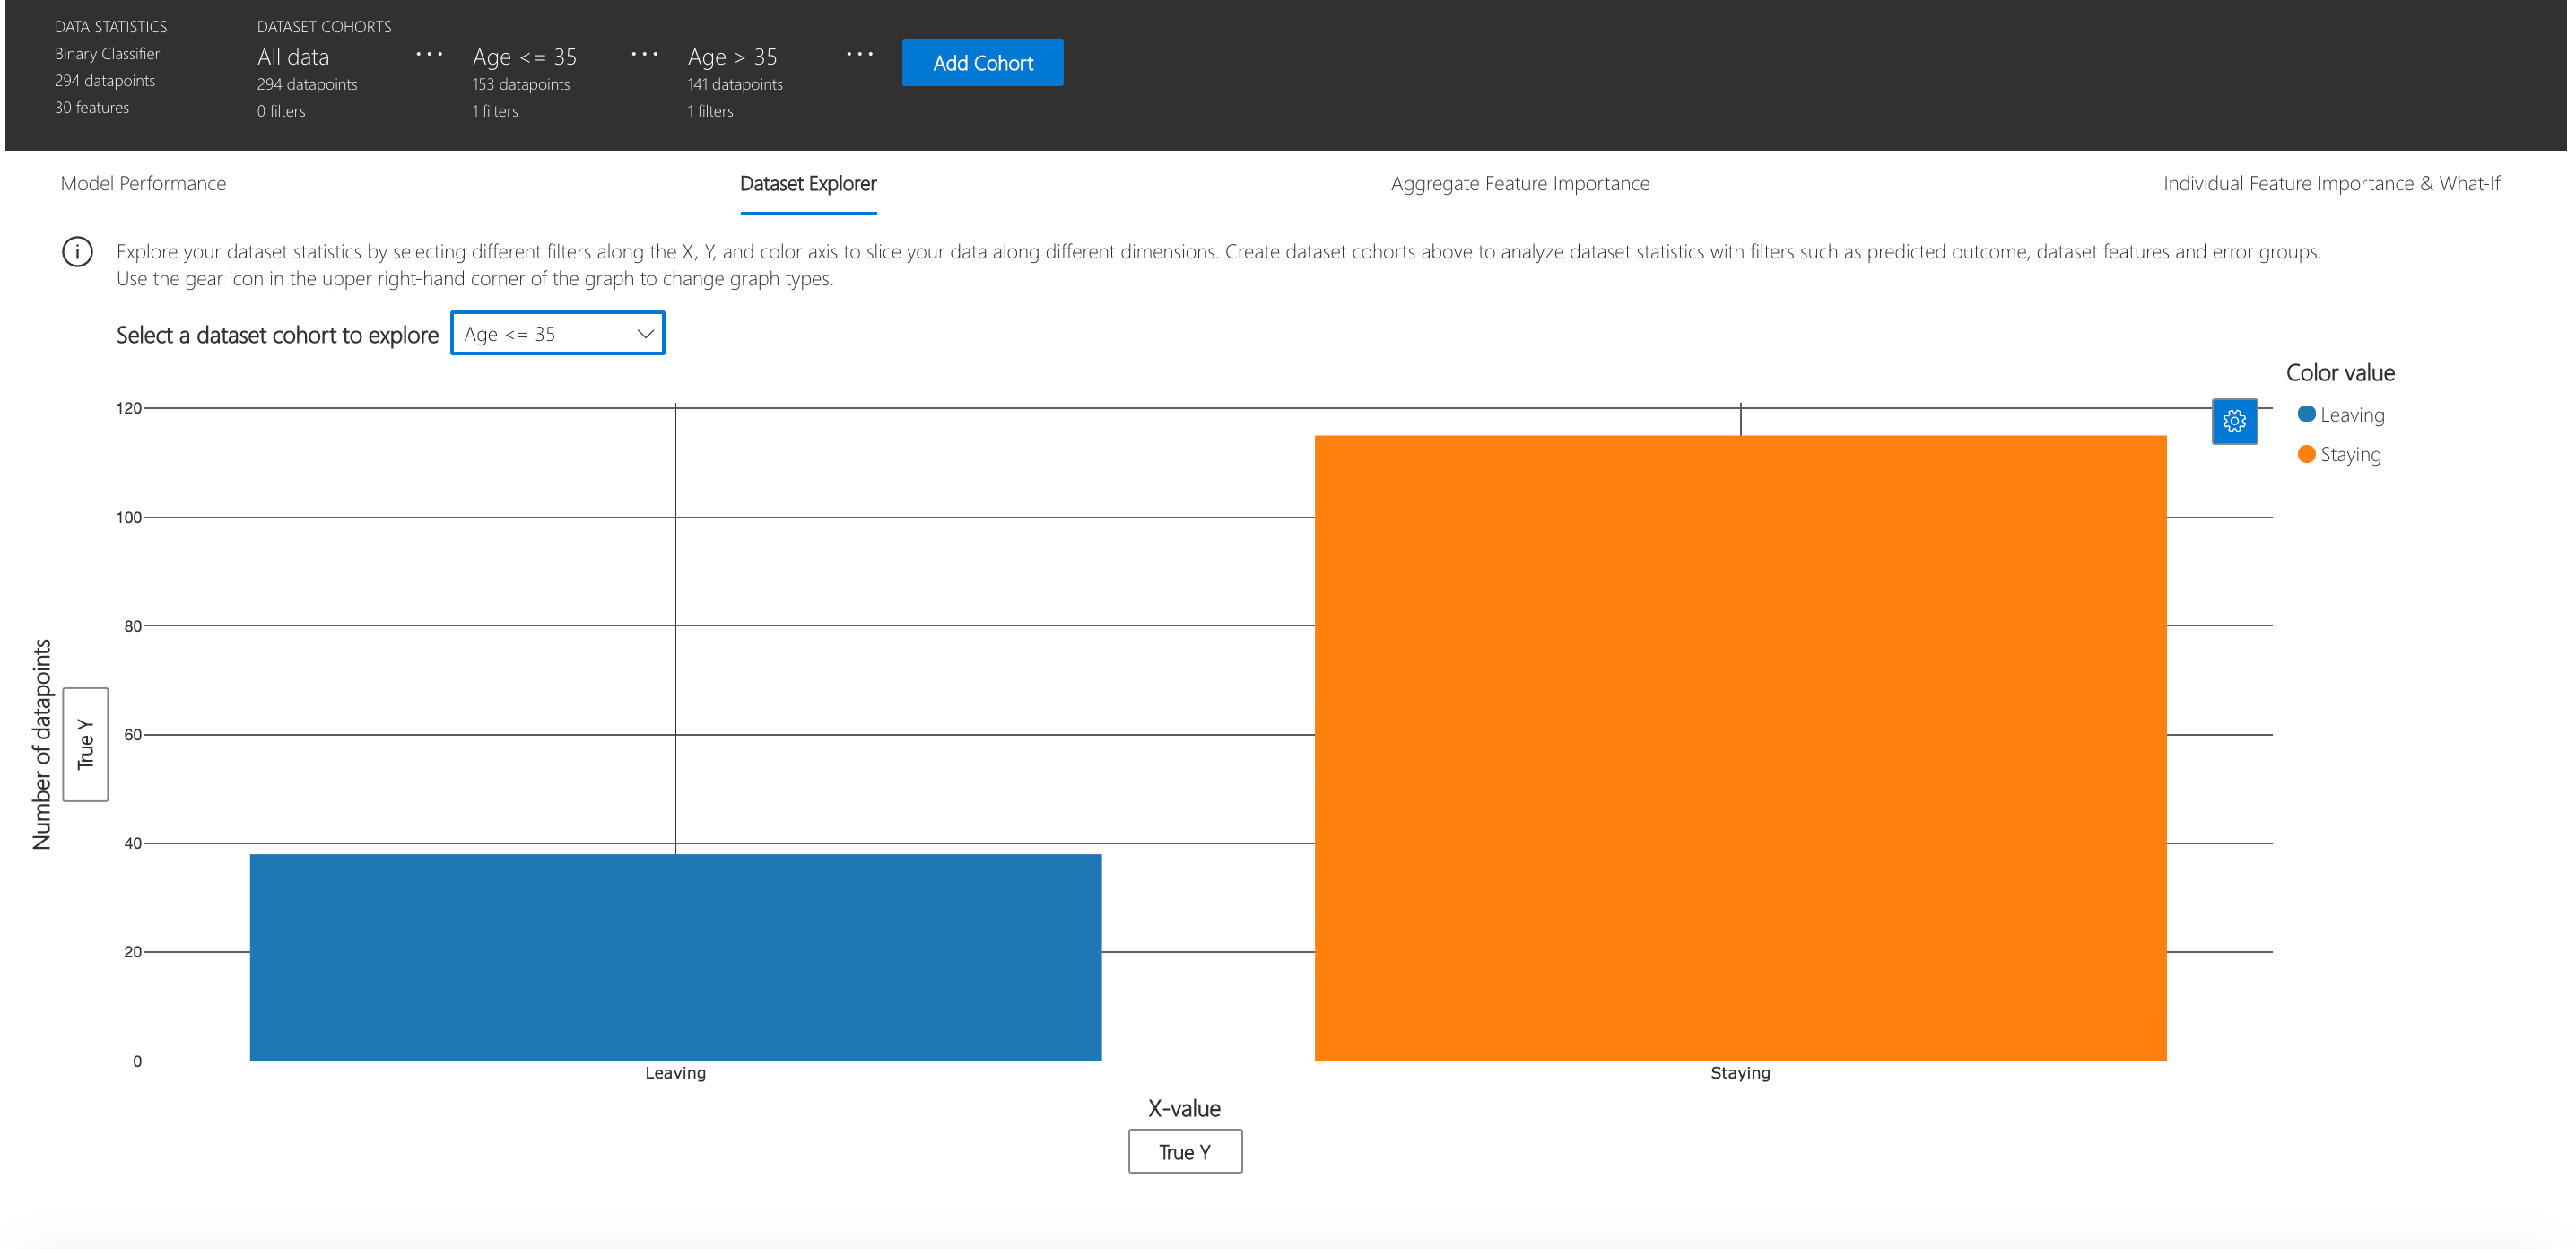
Dataset explorer
You can explore your dataset statistics by selecting different filters along the X, Y, and color axes of this tab to slice your data into different dimensions.
The following plots provide a global view of the trained model along with its predictions and explanations.
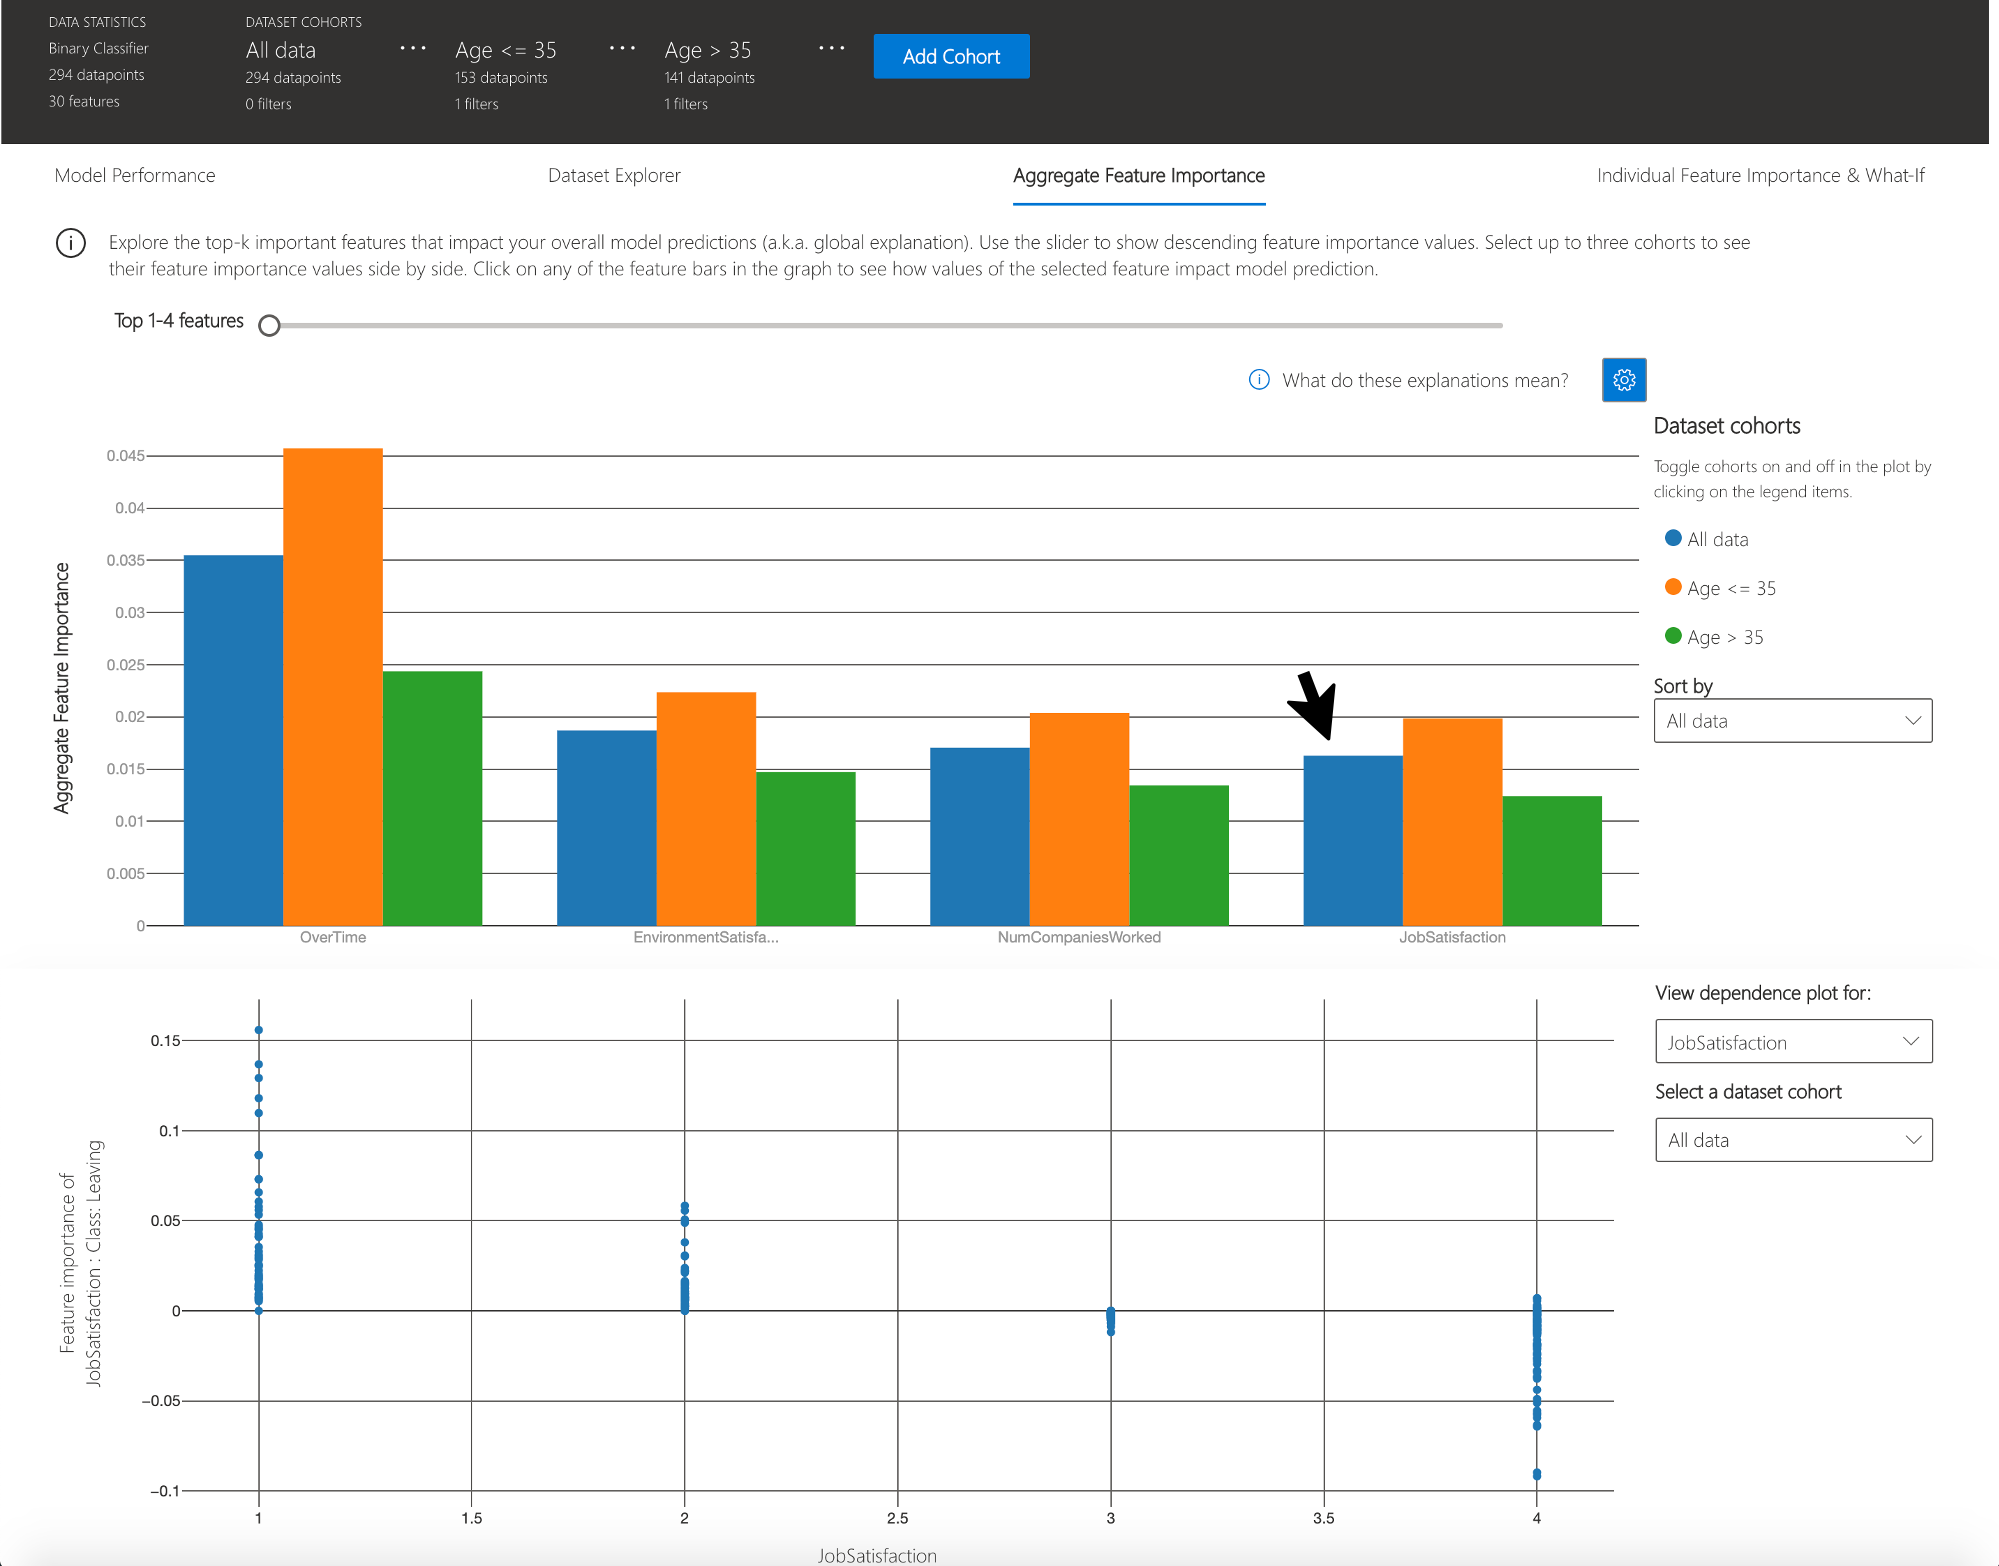
Aggregate feature importance (global explanation)
This view consists of two charts:
Plot |
Description |
|---|---|
Feature Importance |
Explore the top K important features that impact your overall model predictions (a.k.a. global explanation). Use the slider to show additional less important feature values. Select up to three cohorts to see their feature importance values side by side. |
Dependence Plot |
Click on any of the feature bars in the feature importance graph to see the relationship of the values of the selected feature to its corresponding feature importance values. Overall, this plot show how values of the selected feature impact model prediction. |
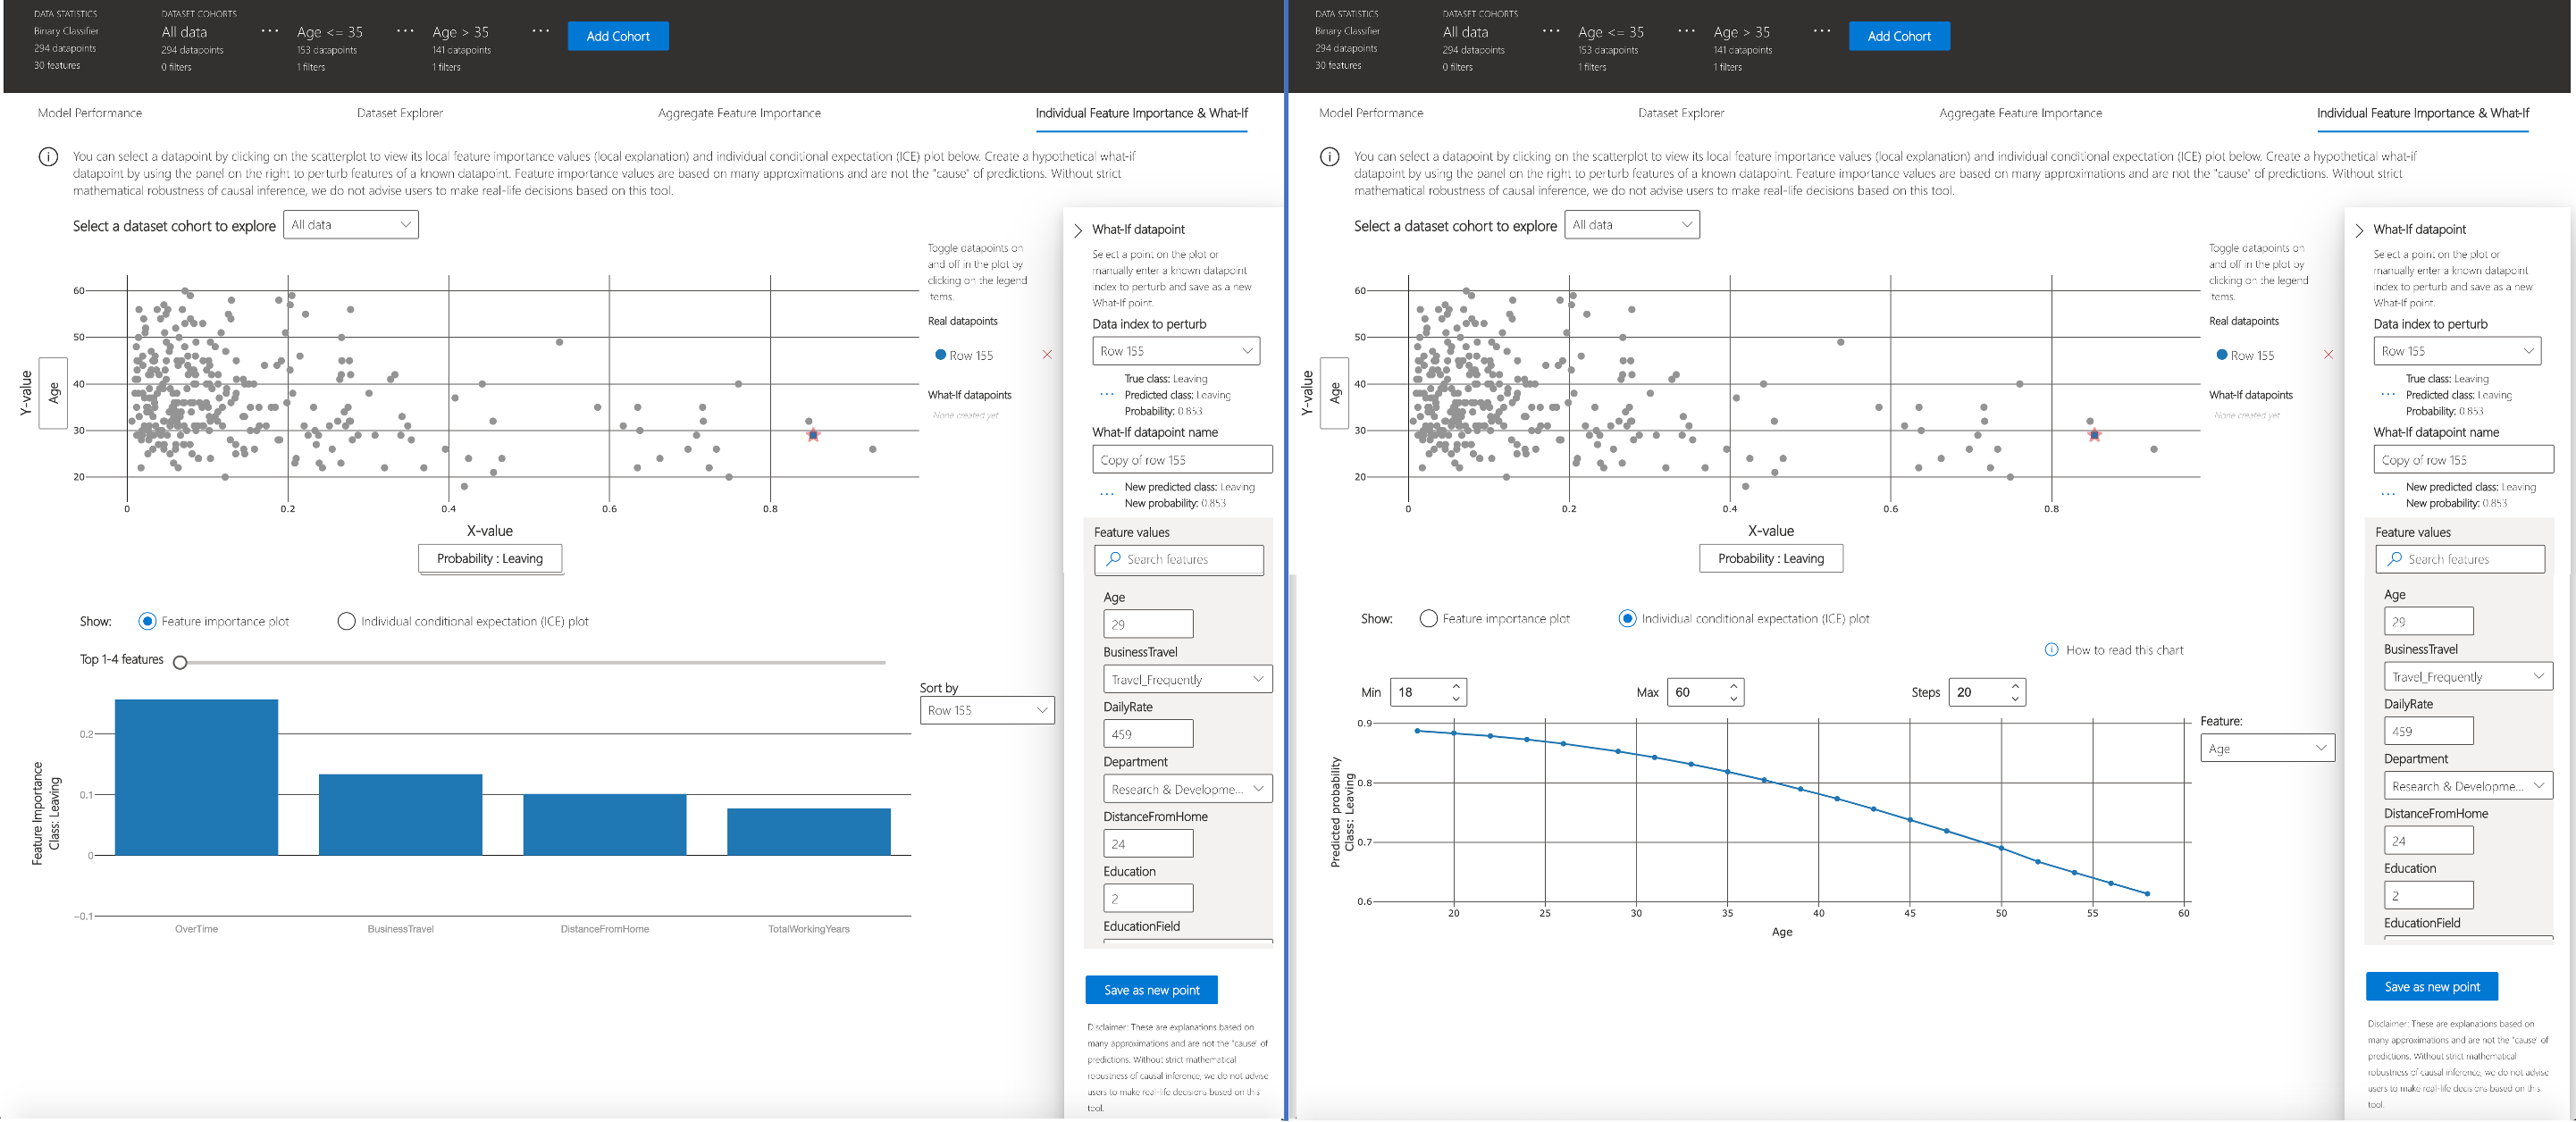
Individual feature importance (local explanation) and what-if
You can click on any individual data point on the scatter plot to view its local feature importance values (local explanation) and individual conditional expectation (ICE) plot below. These are the capabilities covered in this tab:
Plot |
Description |
|---|---|
Feature Importance Plot |
Shows the top K (configurable K) important features for an individual prediction. Helps illustrate the local behavior of the underlying model on a specific data point. |
Individual Conditional Expectation (ICE) |
Allows feature value changes from a minimum value to a maximum value. Helps illustrate how the data point’s prediction changes when a feature changes. |
Perturbation Exploration (what if analysis) |
Allows changes to feature values of the selected data point and observe resulting changes to prediction value. You can then save your hypothetical what-if data point. |